Testimony for the Senate Finance Committee on February 2, 2005
Stephen C. Goss, Chief Actuary Social Security Administration
Mr. Chairman, ranking member, and members of the committee, thank you very much for the opportunity to talk with you today about the future financial status of the Social Security program.
Annual Reports from the Board of Trustees to the Congress on the financial condition of the Old-Age, Survivors, and Disability Insurance program have been prepared continuously starting with1941. These reports are required by law to include an assessment of the “actuarial status” of the Trust Funds. The Office of the Actuary at the Social Security Administration prepares the projections used in these reports as well as projections of the effects of proposals to change the program, and has done so since the inception of the program in 1935.
Today I would like to speak about three aspects of our analysis of the actuarial status of the Social Security program under current law. These are (1) the basic status of financing and solvency over the 75-year long-range period, (2) the principal reason that the financial status is shifting, and (3) some of the longrange measures used for assessing the financial/actuarial status of the program.
(1) Where We Are—The Basic Actuarial Status of the Social Security Program
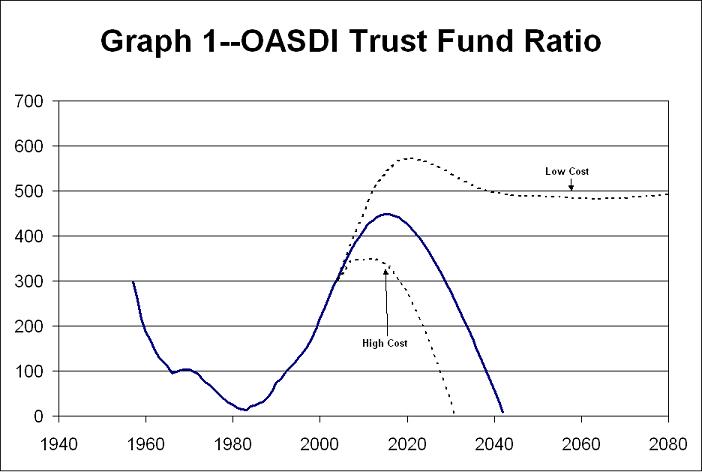
In the 2004 Trustees Report, the intermediate projections indicate that the annual excess of tax income over program cost will begin to decline in 2009, and in 2018 cost will exceed tax income. At that point the accumulated trust fund assets of about $2.3 trillion in present value will begin to be used to augment tax income so that benefits scheduled in current law will continue to be paid in full.
If no changes are made, it is projected that the combined Trust Fund assets would become exhausted in 2042 and the program would no longer be considered to be solvent. This means that we would no longer be able to fully pay benefits scheduled in current law on a timely basis. Instead, we would be able to provide 73 percent of scheduled benefits with continuing tax revenues. After 2042, program cost is projected to continue growing faster than tax income. By 2078, 68 percent of scheduled benefits are expected to be payable.
(2) Why Is the Financial Status Shifting?
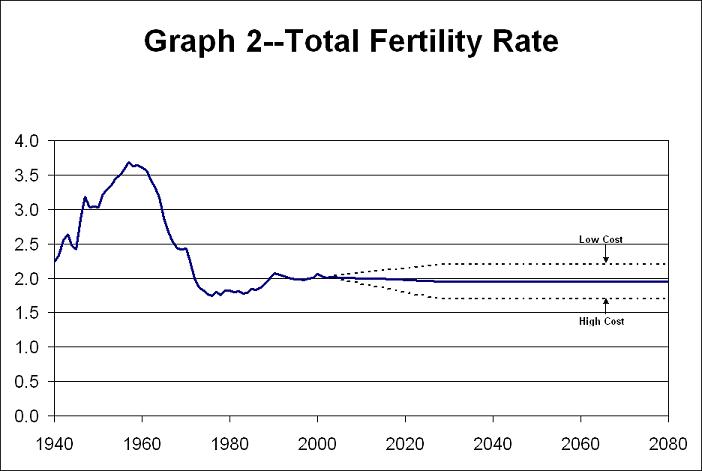
So why is the cost of the program projected to be rising faster than program income? The principal reason is that birth rates rose to a 20-year high level for the period 1946-1965, averaging over 3.3 children per woman, followed by a rapid decline to about 2 children per woman in 1972. Total birth rates have stayed at this relatively low level ever since, and the intermediate projections reflect the assumption that birth rates will continue at this lower level.
A shift in birth rates to lower levels has the direct but delayed effect of increasing the “aged dependency ratio”, that is, the ratio of people over 65 to the working age population between 20 and 64. Graph 3 shows that the aged dependency ratio is projected to rise sharply between 2010 and 2030, as the large baby-boom generation moves above 65 and is replaced at the working ages by the relatively low birth-rate generations that follow them. The continued lower birth rates make the upward shift in this ratio permanent. The more subtle rising tendency in the ratio before 2010 and after 2030 is the result of steady increases in life expectancy.
Graph 4 shows the often cited ratio of workers per beneficiary, which follows almost directly from the trends in the population after the Social Security program matured around 1975. The declines in this ratio through about 1960 were largely due to the maturing of the retirement program. Most workers were covered starting in the 1940’s, but retirement benefits were not available generally to the oldest population until many years later. Further declines in the ratio through about 1975 were largely the result of extending benefits to younger workers who had become disabled. Since 1975, this ratio has been stable at around 3.3 workers per beneficiary, reflecting the stability in the aged dependency ratio. However, the number of workers per beneficiary is projected to decline in concert with the rising aged dependency ratio, starting around 2010, reaching a new relatively stable level of about 2 workers per beneficiary by 2040.
Graph 5 shows the inverse, or flip of the ratio of workers per beneficiary. This is useful because it illustrates the direct relationship between this ratio of beneficiaries to workers and the aged dependency ratio just above it.
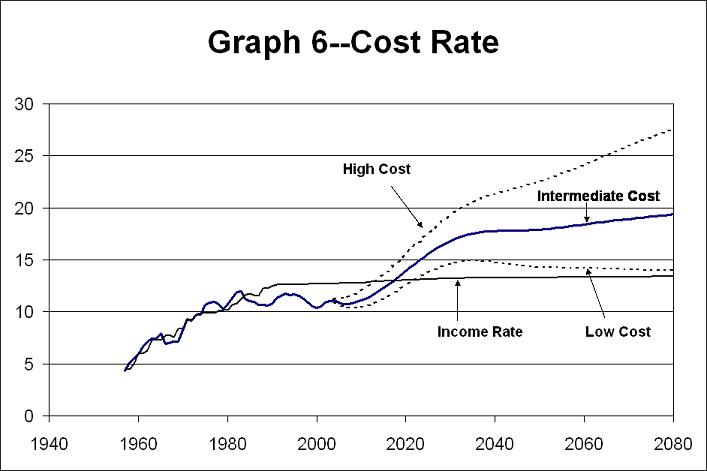
Finally, graph 6 shows the projected cost rate for the Social Security program. This is the annual cost of the program as a percent of the payroll tax base. With the tax income to the program at about 13 percent of taxable payroll, it is evident that the intermediate cost projection moves above income around 2018 and is expected to remain higher. It is also evident from these graphs that the shift to a higher cost rate between 2010 and 2030 is again largely the result of the shift in birth rates.
While uncertainty is inherent in any estimate for the future, these trends are nearly unavoidable and are still evident even for the high-cost and low-cost projections included in the Trustees Report. Stochastic projections included in the last two reports indicate that actual future experience will fall within this range with about a 95 percent probability.
(3) Long-Range Measures of Actuarial Status
As mentioned earlier, solvency of the Social Security program is assessed at each point in time. The program is solvent if there are assets in the Trust Funds sufficient to fully pay scheduled benefits on time. Under the law, the program does not have the authority to borrow when the Trust Funds have become exhausted. While benefit payments would continue after exhaustion of the Trust Funds, they would need to be paid at a reduced level.
Thus, the first real criterion for the actuarial status of Social Security is whether the program is expected to be solvent throughout the 75-year long-range period. The second criterion is whether the program meets the test of sustainable solvency. This test requires that the positive trust fund levels at the end of 75 years are stable or rising as a percent of the annual cost of the program. This condition is generally met if the tax income is stable at about the same level as program cost at the end of the long range period. These have been the two basic goals that have guided legislative proposals developed over the past 10 years.
Summary Measures
Several summary measures have been developed over the years that provide general indications of the adequacy of financing over a period as a whole. However, caution should be exercised in using these summary measures, because they provide no indication of the solvency of the program within the period.
The actuarial deficit of the Social Security program is essentially the shortfall of income needed to fully meet scheduled benefits over the entire period. The actuarial deficit is currently estimated at 1.89 percent of payroll for the 75-year projection period under the intermediate assumptions.
Closely related is the unfunded obligation of the Social Security program, which indicates that the projected shortfall for the next 75 years is about 0.7 percent of GDP for the period as a whole. The unfunded obligation may also be expressed as a total dollar amount in present discounted value. This estimate is $3.7 trillion for the shortfall that must be met over the next 75 years as a whole. Because 75 years is a very long time, estimates for the long-range period are subject to considerable uncertainty.
For the last 2 years the Trustees have also added measures of the unfunded obligation of the program over the infinite future. Due to the length of this time period, these measures are highly uncertain. They are intended only to provide an indication of the potential magnitude of shortfalls over the infinite future as a whole.
Conclusion
The test of sustainable solvency, if met, indicates that the Social Security program is expected to be able to pay scheduled benefits on a timely basis for the foreseeable future. It means that the program is on a financially sustainable path. Currently the Social Security program is in need of some combination of reductions in cost and increases in income to meet this objective. Because the upcoming shift in the cost of the program is closely related to a shift in birth rates, the shortfall can be met by changing the level of benefits or income with a gradual transition over several decades.
Clearly, acting well before we approach the expected date of trust fund exhaustion will be advantageous. By enacting needed changes sooner we will have more options to consider; we will be able to phase changes in more gradually and give affected individuals more advance notice.
Thank you very much for the opportunity to present these remarks.
Social Security Actuarial/Financial Status
Solvency---Ability to Pay Scheduled Benefits with Available Revenue--At any point in time- Requires a positive Trust Fund level--- No borrowing authority under current law
- If benefit cost exceeds current tax revenue, augment with Trust Fund assets (2018)
If Trust Fund assets exhausted, pay what current tax revenue allows (2042)
- Requires a positive Trust Fund through the long-range 75-year period
- Also requires that Trust Fund assets are stable or rising as a percent of annual cost at the end of the long-range period.
- Actuarial Balance--Excess of assets and income over cost--
Expressed as a percent of the payroll tax base, or taxable payroll
A negative actuarial balance is an "unfunded obligation"
Actuarial balance is -1.89 percent of taxable payroll for the 75-year period
- Others measures of Social Security unfunded obligation
These are the net shortfall of income and assets to cover cost over the period
-
For the 75-year Long-Range Period 2004-78
Actuarial deficit 1.89 percent of taxable payroll Unfunded obligation 0.7 percent of GDP Unfunded obligation $3.7 trillion in present value Total effect of changes needed for the next 75 years as a whole For the Infinite Future: 2004 and later HIGHLY UNCERTAIN
Actuarial deficit 3.5 percent of taxable payroll Unfunded obligation 1.2 percent of GDP Unfunded obligation $10.4 trillion in present value Total effect of changes needed for ALL future years as a whole
Prepared by Office of the Chief Actuary, Social Security Administration
January 20, 2005