Annual Wage Trends for Supplemental Security Income Recipients
Social Security Bulletin, Vol. 65, No. 2, 2004
As a means-tested program, the Supplemental Security Income program considers a recipient's income from wages and other sources when determining eligibility and the monthly benefit amount. This study examines annual earnings for a sample of Supplemental Security Income recipients and, in the case of child recipients, their spouses and parents to evaluate the feasibility of using average annual wages in place of monthly wages when determining benefit amounts. The data show substantial variation in earnings from one year to the next. The results do not point to any clear distinctions in wage patterns among recipients or ineligible spouses and parents that would make any one group a better candidate for estimating and verifying wages on an annual basis.
Richard Balkus and Susan Wilschke are with the Office of Disability and Income Assistance Policy, Office of Policy, Social Security Administration.
The findings and conclusions presented in the Bulletin are those of the authors and do not necessarily represent the views of the Social Security Administration.
Summary
The Supplemental Security Income program provides monthly cash benefits to low-income, aged persons and persons with disabilities. The amount of the monthly benefit generally depends on a person's wages and other income from the previous 2 months. Although the rules regarding the counting of wages are relatively straightforward, the process of estimating and verifying monthly wages is burdensome for both beneficiaries and program administrators. In the past, proposals have been made to simplify the program by averaging wages, rather than using the exact amount paid each month, to estimate and verify wages. The absence of data on the variation in wages from year to year, however, has hampered the evaluation of some of these options.
To address this lack of information, this study used wage data for the period 1998–2001 and analyzed the annual wage fluctuation for recipients and "deemors" (ineligible spouses and parents whose income is deemed to be available to recipients). Such data are useful not only for assessing options to simplify wage estimation and verification but also for understanding patterns of participation among Supplemental Security Income recipients in the labor force.
The data show substantial variation in the earnings of wage earners from one year to the next:
- About 75 percent of recipients with earnings in 1998 had earnings in 1999 that differed by more than 20 percent from the previous year.
- Blind and disabled adult recipients with earnings in 1998 were less likely than deemors to have had wages in all 4 years. A higher proportion of deemors worked in all 4 years—69 percent of ineligible parents and 70 percent of ineligible spouses compared with 41 percent of those recipients.
- The mean increases and decreases between years were considerably larger for deemors than they were for other wage earners.
- The data do not show any clear distinctions in wage patterns among the different types of recipients and deemors that would make any one group a better candidate for estimating and verifying wages on an annual basis.
Introduction
Estimating and verifying wages in the Supplemental Security Income (SSI) program is a time-consuming and difficult reporting requirement for SSI recipients and field office personnel. Despite efforts to impress upon recipients the need to report such income on a timely basis, wage income remains the leading cause of incorrect payments in the SSI program. Prior efforts to simplify the program have included options that would require the averaging of wages.
Previous evaluations of options for wage averaging have not addressed the extent to which annual wages fluctuate from year to year for recipients and their deemors (ineligible spouses and parents whose income is deemed to be available to recipients and is counted in determining eligibility and in calculating the benefit amount). Some analysts believe that the annual wages of deemors over a period of several years are more regular and therefore more predictable. This study attempts to determine the extent of wage variation from year to year for recipients and ineligible spouses and parents. The study also identifies wage data by the particular type of wage earner.
Methodology
The study used wage data during the period from 1998 to 2001 that were drawn from the Supplemental Security Record (SSR) 10 percent file for May 2003.1. Records were selected on the basis of the following criteria:
- The recipient received SSI benefits in at least 1 month in calendar year 1998.
- The recipient, spouse, or parent had verified wages for 1 or more months in 1998.
- Wages for all 4 years were verified.
- Only one record was active for the recipient during the 4-year period, and the record remained active through 2001 (that is, the record did not have a start date later than 1997 and was not put into terminated status before 2002).
The objective of using the above criteria was to produce a sample that consisted of recipients with earnings who, in 1999, would be subject to a policy of annually estimating and verifying wages using the previous year's earnings. Consequently, the sample did not include records that did not have wage income in 1998. In addition, the sample did not include records for which wage income may have increased to a level that would preclude a monthly cash benefit and cause the record to terminate before the end of the study period.
The original sample based on the above criteria consisted of 54,778 persons, of which 10,591 were subsequently excluded for a variety of reasons. The sample was redefined to exclude 410 persons with annual wages of $65 or less in each of all 4 years. Some of these records included entries of $1 or less and were probably incorrect. In addition, 10,168 records were excluded because household composition changed (that is, during the study period a parent or spouse left the household or the eligible child attained age 18 and at least one parent had wages). Finally, the records for 13 eligible couples were deleted because one member was denied initially or had benefits that were discontinued following a continuing disability review.
The final sample for study purposes consisted of 44,187 persons. About 54 percent of the persons in this sample are disabled or blind adults. Ineligible parents are the next largest group (31 percent), followed by ineligible spouses (about 10 percent), aged individuals and spouses (slightly more than 3 percent), and blind and disabled children (less than 2 percent).
Results
The study found substantial variation in the continuity of wages and in the amount of wages earned by SSI recipients during the 4-year period. Although all individuals in the sample had verified wages in 1998, only about half had wages in each of the 4 years. Eighteen percent had earnings in 1998 only, and the rest had earnings in some combination of 2 or more years. About 69 percent of ineligible parents and 70 percent of ineligible spouses had earnings in all 4 years, compared with only 41 percent of blind or disabled adults. The percentage of persons with earnings in each year, classified by type of case, is presented in Table 1. The average annual earnings for each year, by type of case, are shown in Table 2. Ineligible parents of children receiving SSI have the highest average income in each of the 4 years. The largest group, disabled adults, has low annual earnings, with average earnings of $2,607 in 1998, decreasing to $2,186 in 2001.
| Type of case | Number in sample |
1998 only | 1998 and 1999 |
1998, 1999, and 2000 |
1998, 1999, 2000, and 2001 |
Other combinations |
|---|---|---|---|---|---|---|
| Recipients | ||||||
| Aged | 1,379 | 41 | 23 | 11 | 21 | 4 |
| Blind or disabled adult | 23,905 | 24 | 14 | 11 | 41 | 10 |
| Blind or disabled child | 817 | 26 | 16 | 15 | 26 | 16 |
| Deemors | ||||||
| Ineligible parent | 13,637 | 9 | 8 | 9 | 69 | 6 |
| Ineligible spouse | 4,449 | 9 | 8 | 8 | 70 | 5 |
| All observations | ||||||
| Total in each year | 44,187 | 18 | 12 | 10 | 52 | 8 |
| SOURCE: Social Security Administration, Supplemental Security Record, 10 percent file, May 2003. | ||||||
| Type of case | Number in sample |
1998 | 1999 | 2000 | 2001 |
|---|---|---|---|---|---|
| Recipients | |||||
| Aged | 1,379 | 3,153 | 2,075 | 1,372 | 970 |
| Blind or disabled adult | 23,905 | 2,607 | 2,468 | 2,376 | 2,186 |
| Blind or disabled child | 817 | 1,215 | 1,283 | 1,467 | 1,425 |
| Deemors | |||||
| Ineligible parent | 13,637 | 10,270 | 11,287 | 11,476 | 11,296 |
| Ineligible spouse | 4,449 | 8,988 | 9,574 | 9,425 | 9,108 |
| All observations | |||||
| Total with wages in each year | . . . | 44,187 | 33,346 | 28,999 | 25,665 |
| SOURCE: Social Security Administration, Supplemental Security Record, 10 percent file, May 2003. | |||||
| NOTE: . . . = not applicable. | |||||
The study looked at the variation (increase and decrease) in wages for three periods: 1998 to 1999, 1999 to 2000, and 2000 to 2001 (see appendix for detailed tables). The variation in wages exceeded 20 percent for about 75 percent of wage earners from 1998 to 1999, for 53 percent from 1999 to 2000, and for 44 percent from 2000 to 2001 (Chart 1).
Absolute value of the percentage chage in annual wages, 1998–2001
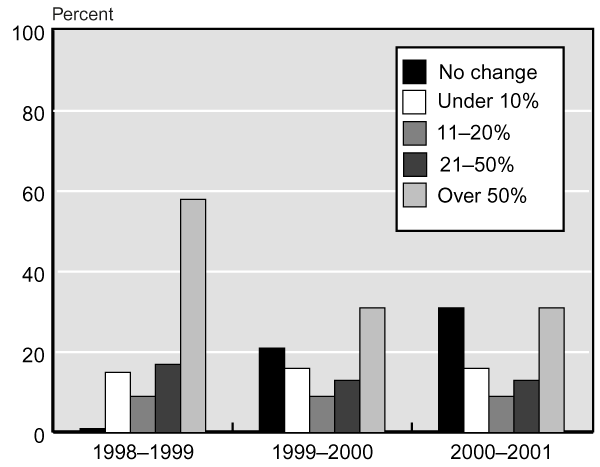
| Year | No change | Under 10% | 11–20% | 21–50% | Over 50% |
|---|---|---|---|---|---|
| 1998–1999 | 1 | 15 | 9 | 17 | 58 |
| 1999–2000 | 21 | 16 | 9 | 14 | 39 |
| 2000–2001 | 31 | 16 | 9 | 13 | 31 |
Twenty-one percent of individuals had no change in wages from 1999 to 2000, and 31 percent had no change between 2000 and 2001. However, the majority of these cases consisted of individuals who had no earnings in either year or whose earnings were equal to or less than $780 per year (the monthly earned income exclusion: $65 × 12 months), so the exact amount would not need to be verified. Only about 2 percent of the cases with no change actually had substantial earnings.
Overall, more people had decreases in wages rather than increases. From 1998 to 1999, 54 percent of all persons with verified wages had a decrease in wages, 45 percent had an increase, and 1 percent experienced no change. From 1999 to 2000, earnings fell for 41 percent and rose for 38 percent. From 2000 to 2001, earnings fell for 36 percent and rose for 33 percent. These findings undoubtedly would be different if the sample had not excluded persons who had no wages in 1998 as well as persons who had wages that may have increased to a level that would preclude a monthly cash benefit and result in the record being terminated before 2002. However, the reported trends for the sample follow the economic downturn in recent years, including higher unemployment rates and lower median incomes.
At comparable levels, the mean dollar increase tends to be higher than the mean dollar decrease. Generally, ineligible fathers have the largest mean increase or decrease, which is not surprising since they also have the highest average earnings.
The data indicate that a large number of persons receiving wages in one year stopped working in the subsequent year. In fact, 13,471 of the 44,187 persons who had wages in 1998 (30 percent) had no wages in either 2000 or 2001. Aged recipients with no wages in those years represented almost two-thirds of all aged recipients in the sample.
The study also looked at the maximum variation in wages from 1998 through 2001 for each wage earner (Chart 2). In analyzing the year-to-year variation, as the greatest percentage increase or decrease in wages, the study found that the most common scenario (for 42 percent of persons overall) was to have wages one year and no wages the following year. Fifty-one percent of blind or disabled adults had no wages in a year following a year of reported wages, and 35 percent had maximum variation of more than 50 percent during the study period. Just over one-third of all cases (37 percent) had year-to-year variation of over 50 percent in at least one year. Ineligible parents were the most likely to have variation of over 50 percent.
Maximum value of the year-to-year fluctuation in wages over the 4-year period for persons with verified wages in 1998–2001, by type of case
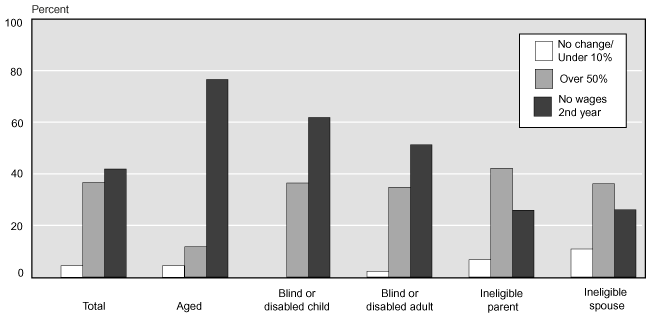
| Persons with verified wages in 1998–2001 |
No change/ under 10% |
Over 50% | No wages 2nd year |
|---|---|---|---|
| Total | 3.9 | 36.6 | 41.9 |
| Aged | 3.9 | 11.8 | 76.5 |
| Blind or disabled child | 0.0 | 36.4 | 61.8 |
| Blind or disabled adult | 2.0 | 34.8 | 51.3 |
| Ineligible parent | 5.7 | 42.2 | 25.9 |
| Ineligible spouse | 9.6 | 36.2 | 26.1 |
Concluding Observations
The results do not point to any clear distinctions in wage patterns among recipients, ineligible spouses, and ineligible parents that would make any one group a better candidate for estimating and verifying wages on an annual basis. Ineligible spouses and parents did have higher earnings and more stable work patterns than recipients. In comparison with recipients, a higher proportion of ineligible spouses and parents had earnings in all 4 years. Such findings suggest that estimating wages on the basis of prior-year earnings would work better for these two groups.
Other findings, however, do not support such a conclusion. For example, 41 percent of ineligible spouses and parents still had wage fluctuation of over 50 percent between at least 2 years during the 4-year period. Another 26 percent had wages in 1 year followed by a year with no wages. In addition, the mean increases and decreases between years for these wage earners were considerably greater than those for other wage earners. For example, for ineligible fathers with an increase or decrease of over 50 percent, including those with wages in 1 year followed by a year of no wages, the mean difference during the 4-year period was between $7,300 and $10,500. Finally, the original sample included an additional 10,168 records that were subsequently dropped because an ineligible spouse or parent left the household during the study period. Such changes in household composition require immediate reporting and would very likely require a wage accounting period of less than 12 months.
The results also suggest that estimating current-year wages on the basis of a prior-year W-2(s) as the starting point may result in more recipients being underpaid than overpaid. The data showed that a higher percentage of recipients in current-payment status during the 4-year period had decreasing wages from year to year, and many wage earners just stopped working for at least 1 year during the study period. In fact, 42 percent of those sampled had a year of wages followed by a year of no wages. For these recipients, using the wage earner's prior-year W-2 as the basis for estimating current earnings would quite likely result in an underpayment. In cases in which that wage earner stopped working altogether, the recipient would still need to report the change in between annual verification times. The amount of underpayment resulting from a break in employment would most likely be no different under annual wage averaging than under current policy. However, the underpayment may be larger for recipients with wages decreasing from year to year, particularly if recipients adhered to an annual verification procedure. These results might look different if the sample included cases that terminated before 2002. Recipients whose records terminated as a result of their own excess earnings or because of earnings deemed to them by a parent or spouse would more likely be overpaid under a wage averaging policy.
The results also provide a richer understanding about the participation of SSI recipients in the labor force. During the past 15 years, roughly 6 percent of recipients reported earnings from employment. Of those sampled, only about half of those employed in one year have earnings in each of the succeeding 3 years.
Appendix
| Type of case | Number in sample |
Percentage with no change |
Percentage with increase of— | Percentage with decrease of— | ||||||||
|---|---|---|---|---|---|---|---|---|---|---|---|---|
| Under 5% |
5– 10% |
11– 20% |
21– 50% |
Over 50% |
Under 5% |
5– 10% |
11– 20% |
21– 50% |
Over 50% |
|||
| Recipients | ||||||||||||
| Aged | ||||||||||||
| Individual | 1,198 | 2 | 3 | 3 | 2 | 4 | 12 | 4 | 3 | 3 | 8 | 57 |
| Spouse | 181 | 2 | 6 | 2 | 6 | 5 | 6 | 4 | 2 | 4 | 8 | 55 |
| Blind | ||||||||||||
| Child | 3 | . . . | . . . | . . . | . . . | 33 | 33 | . . . | . . . | . . . | . . . | 33 |
| Individual | 294 | . . . | 2 | 4 | 4 | 7 | 23 | 4 | 3 | 3 | 9 | 40 |
| Spouse | 5 | . . . | 40 | . . . | . . . | . . . | 20 | . . . | 20 | . . . | . . . | 20 |
| Disabled | ||||||||||||
| Child | 814 | 1 | 1 | 1 | 1 | 5 | 28 | 1 | 1 | 3 | 6 | 50 |
| Individual | 23,215 | 1 | 2 | 3 | 4 | 7 | 22 | 2 | 3 | 4 | 8 | 44 |
| Spouse | 391 | 1 | 2 | 3 | 4 | 5 | 18 | 2 | 3 | 4 | 8 | 50 |
| Deemors | ||||||||||||
| Ineligible | ||||||||||||
| Father | 4,590 | 1 | 8 | 10 | 10 | 12 | 20 | 7 | 4 | 5 | 8 | 16 |
| Mother | 9,047 | 0 | 4 | 6 | 7 | 11 | 27 | 3 | 4 | 4 | 9 | 25 |
| Spouse | 4,449 | 1 | 8 | 8 | 8 | 10 | 21 | 5 | 4 | 5 | 9 | 20 |
| All observations | ||||||||||||
| Total | 44,187 | 351 | 1,710 | 2,036 | 2,429 | 3,723 | 10,036 | 1,442 | 1,428 | 1,746 | 3,740 | 15,546 |
| SOURCE: Social Security Administration, Supplemental Security Record, 10 percent file, May 2003. | ||||||||||||
| NOTE: . . . = not applicable. | ||||||||||||
| Type of case | Number in sample |
Mean dollar increase for percentage change category |
Mean dollar decrease for percentage change category |
||||||||
|---|---|---|---|---|---|---|---|---|---|---|---|
| Under 5% |
5– 10% |
11– 20% |
21– 50% |
Over 50% |
Under 5% |
5– 10% |
11– 20% |
21– 50% |
Over 50% |
||
| Recipients | |||||||||||
| Aged | |||||||||||
| Individual | 1,198 | 120.75 | 367.71 | 564.96 | 1,119.93 | 3,464.71 | 106.29 | 273.88 | 683.58 | 1,378.05 | 2,321.69 |
| Spouse | 181 | 82.70 | 788.50 | 840.82 | 1,390.00 | 4,831.30 | 44.38 | 563.00 | 963.38 | 2,087.07 | 3,259.50 |
| Blind | |||||||||||
| Child | 3 | . . . | . . . | . . . | 73.00 | 1,361.00 | . . . | . . . | . . . | . . . | 1,895.00 |
| Individual | 294 | 165.57 | 757.31 | 1,225.00 | 1,432.38 | 5,107.63 | 111.62 | 312.70 | 997.50 | 1,534.46 | 2,453.06 |
| Spouse | 5 | 152.00 | . . . | . . . | . . . | 407.00 | . . . | 746.00 | . . . | . . . | 3,296.00 |
| Disabled | |||||||||||
| Child | 814 | 48.75 | 155.75 | 233.60 | 547.59 | 2,236.45 | 23.92 | 176.42 | 298.22 | 574.98 | 1,103.97 |
| Individual | 23,215 | 98.56 | 326.48 | 611.43 | 1,110.73 | 3,256.88 | 86.77 | 269.64 | 526.37 | 1,224.47 | 1,943.07 |
| Spouse | 391 | 130.75 | 461.91 | 828.59 | 1,759.48 | 4,081.63 | 165.00 | 339.25 | 428.27 | 1,259.39 | 2,144.23 |
| Deemors | |||||||||||
| Ineligible | |||||||||||
| Father | 4,590 | 493.94 | 1,506.16 | 2,791.57 | 4,771.54 | 10,457.33 | 411.92 | 1,452.00 | 2,745.52 | 5,480.14 | 7,306.26 |
| Mother | 9,047 | 316.10 | 1,029.05 | 1,882.69 | 3,218.60 | 6,832.48 | 295.27 | 950.74 | 1,798.87 | 3,352.34 | 4,417.53 |
| Spouse | 4,449 | 308.88 | 930.84 | 1,777.24 | 3,070.80 | 6,868.76 | 281.15 | 930.87 | 1,893.17 | 3,291.04 | 4,969.29 |
| All observations | |||||||||||
| Total | 44,187 | 273.10 | 862.12 | 1,526.58 | 2,432.85 | 5,139.07 | 230.33 | 688.19 | 1,261.30 | 2,304.24 | 2,747.65 |
| SOURCE: Social Security Administration, Supplemental Security Record, 10 percent file, May 2003. | |||||||||||
| NOTE: . . . = not applicable. | |||||||||||
| Type of case | No change, by reason | Percentage with increase of— | Percentage with decrease of— | ||||||||||
|---|---|---|---|---|---|---|---|---|---|---|---|---|---|
| No wages |
Equal to $780 |
Other | Under 5% |
5– 10% |
11– 20% |
21– 50% |
Over 50% |
Under 5% |
5– 10% |
11– 20% |
21– 50% |
Over 50% |
|
| Recipients | |||||||||||||
| Aged | |||||||||||||
| Individual | 42 | 0 | 2 | 2 | 3 | 2 | 1 | 5 | 2 | 2 | 2 | 5 | 30 |
| Spouse | 39 | . . . | 3 | 3 | 2 | 1 | 3 | 5 | 1 | 2 | 4 | 6 | 30 |
| Blind | |||||||||||||
| Child | 33 | . . . | . . . | . . . | . . . | . . . | . . . | . . . | . . . | . . . | . . . | 33 | 33 |
| Individual | 24 | . . . | . . . | 3 | 2 | 8 | 5 | 16 | 2 | 2 | 4 | 7 | 26 |
| Spouse | 20 | . . . | . . . | 40 | . . . | . . . | . . . | 40 | . . . | . . . | . . . | . . . | . . . |
| Disabled | |||||||||||||
| Child | 29 | 0 | . . . | 0 | 1 | 2 | 4 | 26 | 1 | 1 | 1 | 7 | 28 |
| Individual | 26 | 1 | 0 | 3 | 3 | 4 | 6 | 17 | 2 | 2 | 3 | 7 | 26 |
| Spouse | 36 | . . . | 1 | 2 | 2 | 5 | 6 | 13 | 1 | 3 | 2 | 7 | 23 |
| Deemors | |||||||||||||
| Ineligible | |||||||||||||
| Father | 8 | . . . | 1 | 9 | 11 | 11 | 10 | 11 | 8 | 6 | 5 | 7 | 14 |
| Mother | 11 | . . . | . . . | 5 | 6 | 7 | 10 | 19 | 4 | 4 | 5 | 8 | 21 |
| Spouse | 10 | . . . | 1 | 10 | 9 | 8 | 9 | 12 | 7 | 6 | 4 | 7 | 17 |
| All observations | |||||||||||||
| Total | 8,952 | 130 | 217 | 1,927 | 2,229 | 2,417 | 3,200 | 7,202 | 1,566 | 1,519 | 1,682 | 3,123 | 10,023 |
| SOURCE: Social Security Administration, Supplemental Security Record, 10 percent file, May 2003. | |||||||||||||
| NOTE: . . . = not applicable. | |||||||||||||
| Type of case |
Number in sample |
Mean dollar increase for percentage change category |
Mean dollar decrease for percentage change category |
||||||||
|---|---|---|---|---|---|---|---|---|---|---|---|
| Under 5% |
5– 10% |
11– 20% |
21– 50% |
Over 50% |
Under 5% |
5– 10% |
11– 20% |
21– 50% |
Over 50% |
||
| Recipients | |||||||||||
| Aged | |||||||||||
| Individual | 1,198 | 141.00 | 361.79 | 802.81 | 1,591.35 | 2,814.75 | 90.96 | 414.00 | 602.15 | 1,557.52 | 2,609.12 |
| Spouse | 181 | 96.67 | 755.75 | 381.00 | 1,653.00 | 4,034.89 | 36.50 | 554.50 | 1,554.00 | 1,526.70 | 3,266.96 |
| Blind | |||||||||||
| Child | 3 | . . . | . . . | . . . | . . . | . . . | . . . | . . . | . . . | 693.00 | 391.00 |
| Individual | 294 | 232.75 | 1,071.57 | 1,284.17 | 1,761.13 | 3,972.57 | 179.86 | 466.20 | 821.00 | 2,458.62 | 3,169.77 |
| Spouse | 5 | 712.50 | . . . | . . . | . . . | 2,623.50 | . . . | . . . | . . . | . . . | . . . |
| Disabled | |||||||||||
| Child | 814 | 211.00 | 399.75 | 661.93 | 991.10 | 2,575.13 | 57.20 | 193.57 | 413.63 | 1,123.75 | 1,645.09 |
| Individual | 23,215 | 113.01 | 404.94 | 781.37 | 1,469.57 | 3,285.29 | 104.88 | 359.55 | 664.16 | 1,502.54 | 2,556.09 |
| Spouse | 391 | 135.38 | 581.29 | 1,126.16 | 1,816.88 | 4,223.57 | 90.20 | 510.92 | 526.83 | 2,435.27 | 3,122.18 |
| Deemors | |||||||||||
| Ineligible | |||||||||||
| Father | 4,590 | 501.83 | 1,594.05 | 3,028.20 | 5,309.28 | 9,147.98 | 445.30 | 1,544.69 | 3,210.31 | 5,886.37 | 8,788.68 |
| Mother | 9,047 | 380.99 | 1,124.47 | 2,095.24 | 3,751.96 | 6,385.06 | 352.61 | 1,025.78 | 2,061.03 | 4,075.47 | 5,551.36 |
| Spouse | 4,449 | 300.76 | 1,039.08 | 1,940.45 | 3,479.54 | 5,818.11 | 286.51 | 1,012.98 | 1,973.80 | 4,079.46 | 5,845.64 |
| All observations | |||||||||||
| Total | 44,187 | 302.60 | 967.47 | 1,780.60 | 2,909.67 | 4,618.70 | 273.31 | 841.40 | 1,516.25 | 2,831.94 | 3,752.37 |
| SOURCE: Social Security Administration, Supplemental Security Record, 10 percent file, May 2003. | |||||||||||
| NOTE: . . . = not applicable. | |||||||||||
| Type of case |
No change, by reason | Percentage with increase of— | Percentage with decrease of— | ||||||||||
|---|---|---|---|---|---|---|---|---|---|---|---|---|---|
| No wages |
Equal to $780 |
Other | Under 5% |
5– 10% |
11– 20% |
21– 50% |
Over 50% |
Under 5% |
5– 10% |
11– 20% |
21– 50% |
Over 50% |
|
| Recipients | |||||||||||||
| Aged | |||||||||||||
| Individual | 64 | . . . | 3 | 1 | 2 | 1 | 2 | 3 | 2 | 1 | 1 | 2 | 17 |
| Spouse | 62 | . . . | 1 | 3 | 2 | 3 | 4 | 5 | 2 | 1 | 1 | 4 | 13 |
| Blind | |||||||||||||
| Child | 67 | . . . | . . . | . . . | . . . | . . . | . . . | . . . | . . . | . . . | . . . | 33 | . . . |
| Individual | 37 | . . . | . . . | 2 | 2 | 6 | 5 | 11 | 2 | 3 | 4 | 7 | 20 |
| Spouse | 20 | . . . | . . . | . . . | 20 | . . . | . . . | 20 | 20 | . . . | . . . | 20 | . . . |
| Disabled | |||||||||||||
| Child | 42 | . . . | . . . | 1 | 1 | 2 | 3 | 17 | 1 | 1 | 1 | 5 | 25 |
| Individual | 38 | 1 | . . . | 2 | 3 | 3 | 5 | 13 | 2 | 2 | 3 | 7 | 20 |
| Spouse | 50 | . . . | 1 | 2 | 3 | 2 | 4 | 8 | 2 | 3 | 3 | 5 | 18 |
| Deemors | |||||||||||||
| Ineligible | |||||||||||||
| Father | 13 | . . . | 1 | 10 | 10 | 9 | 8 | 9 | 7 | 6 | 5 | 8 | 14 |
| Mother | 18 | . . . | . . . | 5 | 6 | 7 | 8 | 15 | 4 | 4 | 4 | 9 | 19 |
| Spouse | 17 | . . . | 2 | 8 | 9 | 8 | 7 | 10 | 7 | 5 | 5 | 7 | 16 |
| All observations | |||||||||||||
| Total | 13,471 | 121 | 221 | 1,864 | 2,119 | 2,184 | 2,570 | 5,540 | 1,537 | 1,437 | 1,636 | 3,139 | 8,348 |
| SOURCE: Social Security Administration, Supplemental Security Record, 10 percent file, May 2003. | |||||||||||||
| NOTE: . . . = not applicable. | |||||||||||||
| Type of case |
Number in sample |
Mean dollar increase for percentage change category |
Mean dollar decrease for percentage change category |
||||||||
|---|---|---|---|---|---|---|---|---|---|---|---|
| Under 5% |
5– 10% |
11– 20% |
21– 50% |
Over 50% |
Under 5% |
5– 10% |
11– 20% |
21 50% |
Over 50% |
||
| Recipients | |||||||||||
| Aged | |||||||||||
| Individual | 1,198 | 112.27 | 369.41 | 698.56 | 1,229.16 | 2,839.00 | 100.42 | 318.64 | 708.73 | 2,232.31 | 2,730.66 |
| Spouse | 181 | 137.40 | 442.33 | 992.00 | 1,315.13 | 4,448.44 | 111.25 | 740.00 | 751.00 | 2,795.00 | 4,129.67 |
| Blind | |||||||||||
| Child | 3 | . . . | . . . | . . . | . . . | . . . | . . . | . . . | . . . | 571.00 | . . . |
| Individual | 294 | 322.14 | 1,243.80 | 1,544.61 | 2,271.57 | 5,489.67 | 225.43 | 493.13 | 1,181.33 | 1,747.76 | 4,196.56 |
| Spouse | 5 | . . . | 686.00 | . . . | . . . | 2,212.00 | 724.00 | . . . | . . . | 4,476.00 | . . . |
| Disabled | |||||||||||
| Child | 814 | 70.38 | 401.60 | 545.23 | 1,650.71 | 2,897.71 | 107.40 | 291.75 | 697.42 | 1,725.49 | 2,002.94 |
| Individual | 23,215 | 131.82 | 449.39 | 856.12 | 1,513.51 | 3,426.41 | 110.58 | 389.86 | 750.03 | 1,601.15 | 3,015.47 |
| Spouse | 391 | 186.25 | 845.18 | 1,690.83 | 1,903.53 | 3,821.06 | 167.89 | 384.50 | 841.45 | 2,381.55 | 3,151.03 |
| Deemors | |||||||||||
| Ineligible | |||||||||||
| Father | 4,590 | 538.86 | 1,634.37 | 3,090.77 | 5,606.68 | 9,772.06 | 521.2 | 1,672.52 | 3,282.03 | 6,616.75 | 9,454.90 |
| Mother | 9,047 | 372.07 | 1,240.54 | 2,228.50 | 3,922.61 | 6,920.19 | 334.29 | 1,130.93 | 2,296.08 | 4,502.11 | 6,253.77 |
| Spouse | 4,449 | 350.09 | 1,109.21 | 2,012.57 | 3,706.14 | 6,473.94 | 298.56 | 1,042.65 | 2,058.57 | 4,213.40 | 6,372.36 |
| All observations | |||||||||||
| Total | 44,187 | 333.76 | 1,054.66 | 1,875.03 | 3,036.35 | 5,018.40 | 282.06 | 907.23 | 1,700.81 | 3,184.43 | 4,438.37 |
| SOURCE: Social Security Administration, Supplemental Security Record, 10 percent file, May 2003. | |||||||||||
| NOTE: . . . = not applicable. | |||||||||||
Note
1. For information on standard errors from the 10 percent files, see Social Security Administration, SSI Annual Statistical Report, 2002 (Washington, DC: SSA, Office of Policy, 2003), Table A–2.