Effective/Publication Date: 07/31/2007
Federal Register Vol. 72, No. 146, page 41796
POLICY INTERPRETATION RULING
SSR 07-01p: Titles II and XVI: Evaluating Visual Field Loss Using Automated Static Threshold Perimetry
PURPOSE:
To clarify how we use automated static threshold perimetry to evaluate visual field loss.
CITATIONS (AUTHORITY):
Sections 205(a), 216(i)(1), 221, 223(d), 1614(a), 1631(d), and 1633 of the Social Security Act (Act), as amended; Regulations No. 4, subpart P, sections 404.1520, 404.1525, 404.1526, 404.1581, and 2.00A, 2.03, 102.00A, and 102.03 of appendix 1; and Regulations No.16, subpart I, sections 416.920, 416.924, 416.925, 416.926, and 416.981.
PERTINENT HISTORY:
The Act provides for a finding of blindness based on visual field loss when the widest diameter of the visual field in the better eye subtends an angle no greater than 20 degrees. Even when visual field loss does not result in blindness, it may nevertheless be disabling. In sections 2.00A6 and 102.00A6 of the Listing of Impairments in appendix 1 to subpart P of part 404 (the listings) we provide that when we need to measure the extent of visual field loss, we will use visual field measurements obtained with an automated static threshold perimetry test that satisfies our requirements.[1]
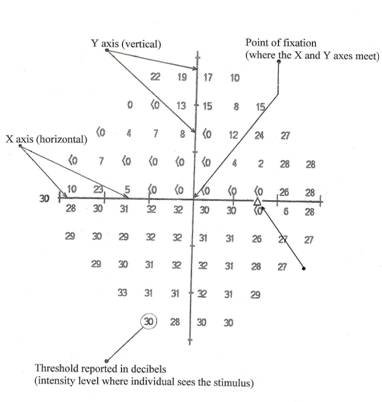
Automated static threshold perimetry measures the retina's sensitivity to light at predetermined locations in the visual field. While the individual focuses on a specific point, called the point of fixation, stimuli are presented in random order at each of the predetermined locations within the visual field. The size of the stimulus and the locations tested remain constant, but the intensity (brightness) of the stimulus is varied in order to determine the level at which the individual sees the stimulus. The intensity level where the individual sees the stimulus is referred to as the threshold. The threshold for each point tested is reported in decibels (dB).
The results of automated static threshold perimetry are reported on standard charts. (See Exhibits 1 and 2 at the end of this ruling for examples of standard charts that may be found in case records.) These charts:
Identify the perimeter that was used to perform the test;
Provide identifying information about the test, such as the date of the test, the type of test used, the size and color of the stimulus, and the background illumination;
Provide the mean deviation (MD);[2] and
Contain a printout that shows the threshold, in dB, for each of the locations tested. We refer to this printout, examples of which are shown below, as the dB printout.
In this Ruling we explain:
How to use the information in the standard charts produced as part of automated static threshold perimetry to determine whether the visual field test satisfies our requirements. To illustrate this, we refer to standard charts produced by the Humphrey Field Analyzer. We refer only to the Humphrey Field Analyzer because it is the perimeter most widely used in the United States.
How to use the MD to determine whether the individual has visual field loss.
Our process for determining whether the test results show statutory blindness based on visual field loss.[3]
How to evaluate cases in which severe visual field loss has not resulted in statutory blindness.
POLICY INTERPRETATION:
We use the following process to evaluate automated static threshold perimetry.
Step 1—Is the automated static threshold perimetry test acceptable?
We consider an automated static threshold perimetry test to be acceptable when it meets all of the following requirements:
The test is performed on a perimeter that satisfies all of the requirements in sections 2.00A6a(ii) and 102.00A6a(ii) of the listings;[4]
The test uses a white size III Goldmann stimulus and a 31.5 apostilb (asb)[5] (10 candela (cd)/m²) white background;[6]
The points tested are no more than 6 degrees apart horizontally or vertically; and
The test measures the central 24 to 30 degrees of the visual field; that is, the area measuring 24 to 30 degrees around the point of fixation.
The Humphrey Field Analyzer central 30-2 threshold test (HFA 30-2) and central 24-2 threshold test (HFA 24-2) are tests that can meet these criteria. The HFA 30-2 tests 76 points in the central 30 degrees of the visual field. The HFA 24-2 tests 54 points in the central 24 to 30 degrees of the visual field. For both of these tests, the tested points are spaced in an equidistant grid pattern, with each point 6 degrees apart horizontally or vertically from any adjacent point. Therefore, we consider the HFA 30-2 and the HFA 24-2 to be acceptable tests when performed using a size III white stimulus on a 31.5 asb white background.
The following examples of dB printouts illustrate the grid patterns used for the HFA 30-2 and the HFA 24-2 and provide information for interpreting the test results.
Example 1—An HFA 30-2 dB printout for the right eye
Example 2—An HFA 30-2 dB printout for the left eye
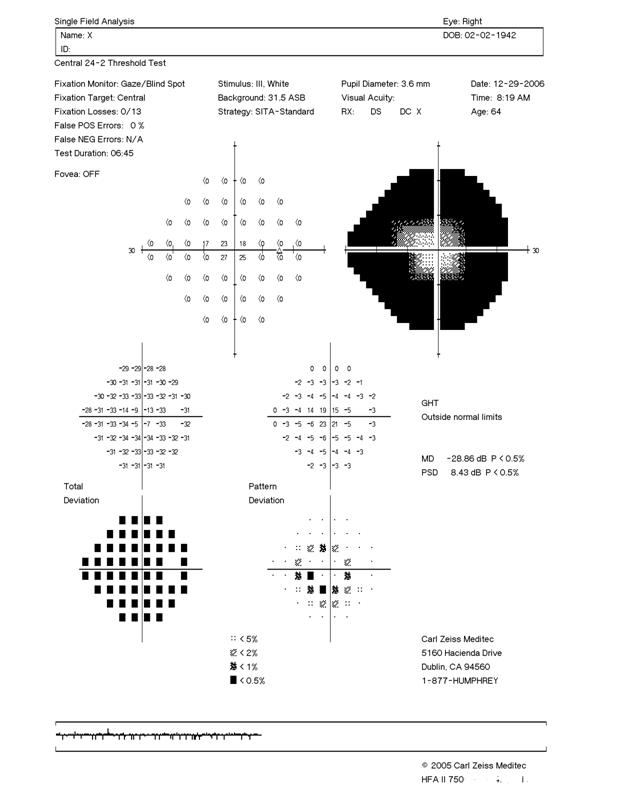
Example 3—An HFA 24-2 dB printout for the right eye
Example 4—An HFA 24-2 dB printout for the left eye
We will not use automated static threshold perimetry test results to evaluate the visual field loss if the test was not performed using all of our requirements; for example, a stimulus other than a size III stimulus was used, or the stimulus was not white.
Step 2—Are the test results reliable?
Each perimeter manufacturer will identify factors that are used to determine whether the test results are reliable.
For the Humphrey Field Analyzer, the reliability factors are fixation losses, false positive errors, and false negative errors. Information about these factors is at the top of the chart (see Exhibits 1 and 2). The test results are not reliable for evaluating visual field loss if the fixation losses exceed 20 percent, or if the false positive errors or false negative errors exceed 33 percent.
Even when the reliability factors are within the manufacturer's specifications, we will not use the test results to evaluate visual field loss if there is other information in the case file that suggests that the results are not valid; for example, the test results are inconsistent with the clinical findings or the individual's daily activities.
Step 3—Does the individual have visual field loss?
For acceptable tests performed on a Humphrey Field Analyzer, an MD equal to or greater than -5 dB (for example, -4.39, -2.58, or 0) indicates that the visual field is normal. An MD less than -5 dB (for example, -5.5, -8.85, or -11.18) indicates the individual has visual field loss.
Step 4—Do the test results show statutory blindness based on visual field loss?
In automated static threshold perimetry, the intensity of the stimulus varies. We measure the extent of visual field loss by determining the portion of the visual field in which the individual can see a white III4e stimulus. The “III” refers to the standard Goldmann test stimulus size III. The “4e” refers to the standard Goldmann filters used to determine the intensity of the stimulus. Therefore, a determination is needed as to the dB threshold level that corresponds to a 4e intensity for the particular perimeter being used. Points that are at this dB threshold level or above are considered seeing points because they are the same intensity or dimmer than a 4e stimulus. Points that are below this dB threshold level are considered non-seeing points because they are brighter than a 4e stimulus.
For acceptable tests performed on a Humphrey Field Analyzer, a 10 dB threshold is equivalent to a 4e intensity. Therefore, for these tests we consider any point with a threshold of 10 dB or higher to be a seeing point; we consider any point with a threshold of less than 10 dB to be a non-seeing point (see sections 2.00A6a(vii) and 102.00A6a(vii) of the listings).
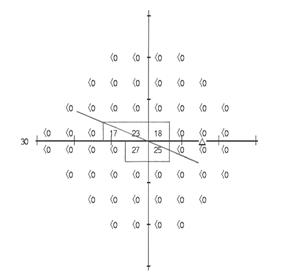
After we determine the dB threshold that is comparable to a 4e stimulus, we use the dB printout to determine whether the widest diameter of the field is less than or equal to 20 degrees. The diameter must go through the point of fixation.
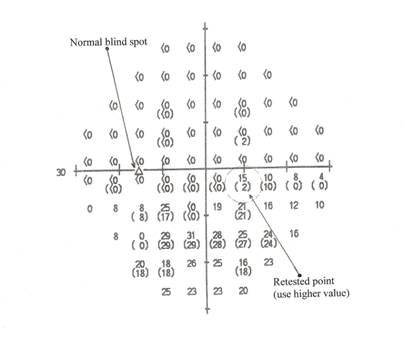
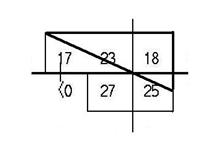
To determine whether the widest diameter is greater than 20 degrees, we may map the visual field on a copy of the dB printout by drawing a line, which we refer to as a pseudoisopter, midway between the seeing and non-seeing points.[7] For example, for acceptable tests performed on a Humphrey Field Analyzer, we draw the pseudoisopter between any two adjacent tested points when one threshold is 10 dB or greater and the other threshold is less than 10 dB. If any number at the outermost edge of the field is a seeing point, we draw the pseudoisopter on the edge of the field at that point. If more than one number is shown for a particular point, we use the higher number to determine whether the point is a seeing point. We include the map of the visual field in the case record.
The pseudoisopter(s) differentiates the seeing area of the visual field from the non-seeing area. We consider the pseudoisopter itself to be part of the seeing area.
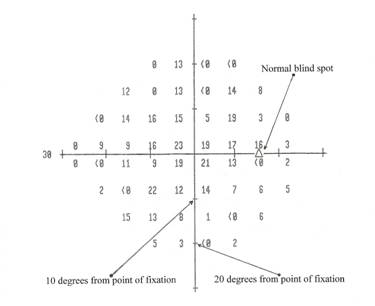
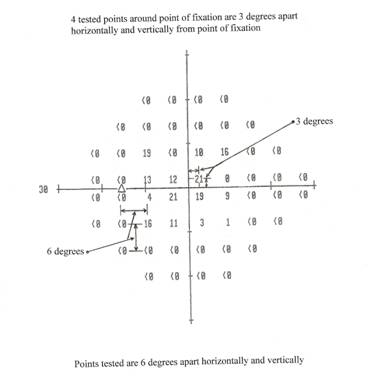
We determine whether the widest diameter is greater than 20 degrees by using the hash marks on the horizontal (x-) and vertical (y-) axes of the Humphrey Field Analyzer dB printout or by calculating the distance between the points. As shown above, for the HFA 30-2 and the HFA 24-2, each hash mark covers a distance of 10 degrees, and the degrees are divided evenly between the hash marks. Additionally, each tested point on a dB printout from an HFA 30-2 or an HFA 24-2 is 6 degrees apart horizontally or vertically from any adjacent tested point. The four tested points immediately surrounding the point of fixation are each 3 degrees horizontally and vertically from the point of fixation. Any tested point adjacent to an axis is 3 degrees from that axis.
When we measure the widest diameter of the visual field, we subtract the length of any scotoma (non-seeing area), other than the “normal” blind spot,[8] from the overall length of any diameter on which it falls. (On some Humphrey Field Analyzer dB printouts, the normal blind spot is identified by a small triangle, as shown in Example 1.) As previously noted, we consider the pseudoisopter to be a seeing area and do not subtract it from the overall length of the diameter.
We will determine that the individual has statutory blindness if the widest diameter in the better eye is less than or equal to 20 degrees, this finding is consistent with the other evidence in the case record, and for title II, a medically determinable impairment that could result in the visual field loss has been identified.
Examples of how we determine whether the individual has statutory blindness based on visual field loss.
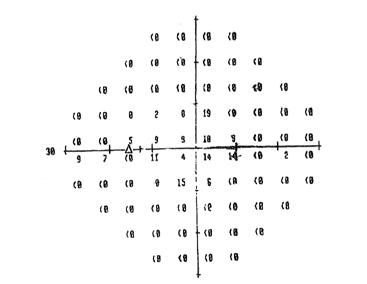
Example 5—An HFA 30-2 dB printout for the right eye
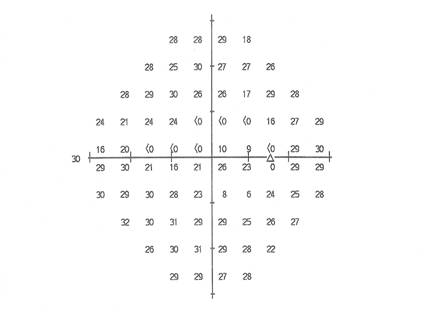
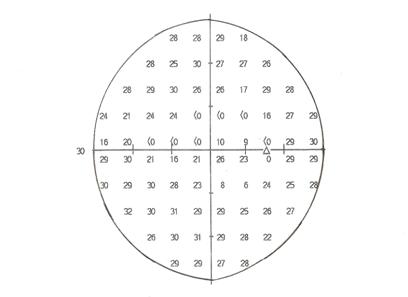
To measure the widest diameter, we create a pseudoisopter by drawing a line midway between points with a threshold of 10 dB and higher and adjacent points with a threshold less than 10 dB, or by drawing the pseudoisopter on the edge of the tested area when the thresholds at the outermost points are 10 dB or higher. As all of the outermost points on the dB printout above are 10 dB or higher, we draw the pseudoisopter delineating the outer edge of the visual field around the tested area.
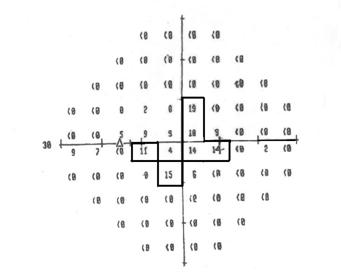
After determining the outer edge of the seeing area as shown on the dB printout, we need to determine whether there are any scotomata; that is, blind spots. If so, we map the scotomata as we do not consider them when we determine whether the widest diameter of the visual field is greater than 20 degrees. A scotoma is illustrated below.
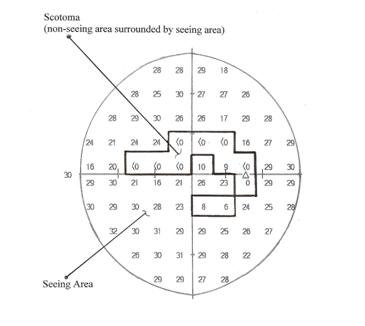
As all of the thresholds in the lower left quadrant of this dB printout are higher than 10 dB, we consider this entire quadrant to be a seeing area. Any diameter that is drawn through this quadrant will be at least 30 degrees long. Therefore, without calculating the actual length of the widest diameter shown on the dB printout, we can determine that the widest diameter of this visual field must be greater than 20 degrees and that this individual does not have statutory blindness based on visual field loss.
Although we did not need to calculate the widest diameter for this example, the widest diameter shown on this dB printout is 54 degrees on both axes. On the y-axis, the diameter extends from the top of the dB printout to the bottom of the dB printout, which is 60 degrees in length. However, there is a segment of the y-axis that is in the scotoma, the segment from 6 degrees to 12 degrees.[9] This segment is 6 degrees long (calculated on the y-axis by adding the 3 degrees above the non-seeing point to the 3 degrees below it). We subtract the 6 degrees from the 60 degrees for a total diameter of 54 degrees.
On the x-axis, the diameter extends from one side of the dB printout to the other side of the dB printout, which is 60 degrees in length. However, there is a segment of the x-axis that is in the scotoma, the segment from 12 degrees to 18 degrees.[10] This segment is 6 degrees long. We subtract the 6 degrees from the 60 degrees for a diameter of 54 degrees.
Example 6—An HFA 30-2 dB printout for the left eye
To measure the widest diameter, we create a pseudoisopter by drawing a line midway between points with a threshold of 10 dB and higher and adjacent points with a threshold less than 10 dB.
The widest diameter is 24 degrees on the y-axis. We can determine that the individual does not have statutory blindness based on visual field loss because the widest diameter is greater than 20 degrees.
Example 7—An HFA 24-2 dB printout for the right eye
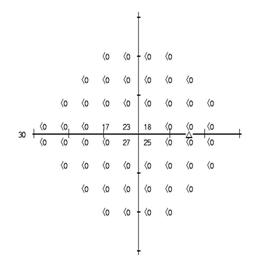
To measure the widest diameter, we create a pseudoisopter by drawing a line midway between points with a threshold of 10 dB or higher and adjacent points with a threshold less than 10 dB.
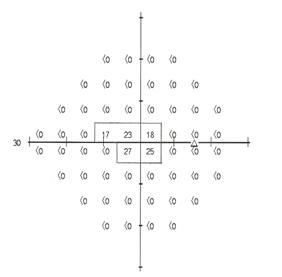
The widest diameter is shown below.
The widest diameter is on a diagonal; therefore, we calculate its length as the hypotenuse of a right triangle.[11] The widest diameter extends from the point in the field that is 6 degrees above and 12 degrees to the left of the point of fixation, through the point of fixation, to the point in the field that is 3 degrees below and 6 degrees to the right of the point of fixation. These two points are 9 degrees apart vertically and 18 degrees apart horizontally, as shown below.
18 degrees
 9 degrees
To measure the widest diameter, we apply the formula for calculating the length of the hypotenuse of a right triangle as follows: 9² + 18² = 81 + 324 = 405. The widest diameter is the square root of 405, or 20.12 degrees, which we round to 20 degrees.[12] Assuming that this is the individual's better eye, that the field shown is consistent with the other evidence in file, and for a title II claim, that there is a medically determinable impairment that could cause this field loss, we will find that the individual has statutory blindness.
Step 5—How do we evaluate severe visual field loss that has not resulted in statutory blindness?
If the individual's visual disorder has resulted in severe visual field loss but has not resulted in statutory blindness, we will consider whether the visual disorder meets listing 2.03B or 102.03B. A visual disorder meets listing 2.03B or 102.03B when the MD for the better eye, measured with an HFA 30-2, is -22 dB or worse.[13] If the visual disorder does not meet a listing, we will determine whether the visual disorder medically equals a listing or, if not, assess the limitations imposed by the visual disorder.
Exhibit 1—Standard Chart from an HFA 30-2
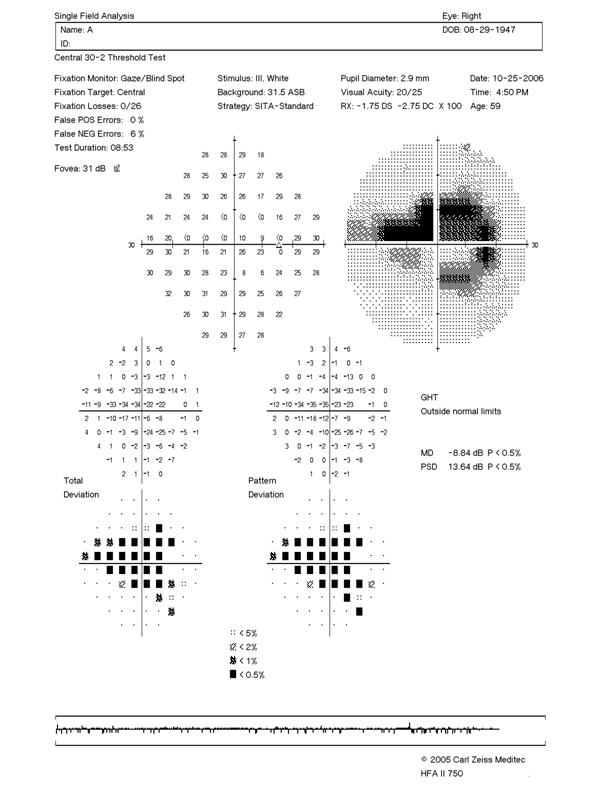
Exhibit 2—Standard Chart from an HFA 24-2
EFFECTIVE DATE:
This Ruling is effective upon publication in the Federal Register.
CROSS-REFERENCES:
Program Operations Manual System DI 34001.012 and DI 34005.102; Special Senses and Speech – Adult, Program Policy Online 104167188, Special Senses and Speech – Child, Program Policy Online 734761857.
[1] Our rules provide that in addition to automated static threshold perimetry we can use comparable visual field measurements obtained with kinetic perimetry, such as Goldmann perimetry. Because we allow for different types of testing, our listings provide comparable criteria that can be used with the different types of test results. Accordingly, only one type of testing is needed to evaluate visual field loss under our listings.
[2] The MD represents the average elevation or depression of the individual's visual field when compared to a normal field. This measurement is expressed in dB.
[3] We developed our process to enable us to apply the results of automated static threshold perimetry to the standard for statutory blindness. Health care providers do not use our process in their clinical practices or for treatment purposes.
[4] As of the effective date of this ruling, all models of the Humphrey Field Analyzer satisfy these requirements.
[5] An apostilb is a unit of luminance.
[6] The background color is not shown on the standard charts produced by the Humphrey Field Analyzer. However, as of the effective date of this ruling, the Humphrey Field Analyzer always uses a white background if a white stimulus is used.
[7] A pseudoisopter is similar to an isopter drawn as part of kinetic visual field testing. Drawing a pseudoisopter assists in determining the location of the widest diameter of the visual field and whether that diameter is 20 degrees or less. However, we do not always need to draw a pseudoisopter to determine whether the widest diameter is 20 degrees or less. For example, if the only seeing points on the dB printout are the four locations around the point of fixation, we can determine that the widest diameter of the visual field is less than 20 degrees without drawing a pseudoisopter. If all the points in an entire quadrant of the dB printout are seeing points, we can determine that the widest diameter is greater than 20 degrees.
[8] The normal blind spot is usually located 15.5 degrees temporal to fixation (to the right for the right eye, to the left for the left eye) and 1.5 degrees below the horizontal meridian. It is approximately 5.5 degrees in width and 7.5 degrees in length.
[9] We would not deduct the segments of the y-axis from the point of fixation to 6 degrees or from -6 to -12 degrees because those segments are part of the pseudoisopter and we consider the pseudoisopter to be a seeing area.
[10] This segment includes the “normal” blind spot, which is usually not deducted from the visual field. However, because the area around the “normal” blind spot is part of the non-seeing area, the “normal” blind spot is no longer considered “normal” and we include it as part of the scotoma.
[11] The formula for calculating the length of the hypotenuse of a right triangle is a² + b² = c², where a and b represent the vertical and horizontal distances between two points and c represents the diagonal distance between two points.
[12] When determining the widest diameter of the visual field, follow the normal rules for rounding to the nearest whole number; that is, round decimals below 0.5 down to the lower whole number and round decimals 0.5 and above up to the higher whole number.
[13] An HFA 24-2 cannot be used to determine if the visual disorder meets or medically equals listing 2.03B or 102.03B because the criterion in those listings was calculated using an HFA 30-2. An MD calculated using an HFA 24-2 cannot be substituted for an MD calculated using an HFA 30-2.