Testimony of Stephen C. Goss, Chief Actuary, Social Security Administration
Before the Subcommittee on Social Security, Pensions, and Family Policy
of the Senate Committee on Finance
May 21, 2014
Chairman Brown, Ranking Member Toomey, and members of the Subcommittee, thank you for the opportunity to testify today on this important topic. Social Security plays a critical foundational role for the retirement income of virtually all Americans. It is often referred to as a “floor of protection” and one of the “three legs of the stool” for retirement income. However, it provides even more than that by covering insured workers and their families against loss of income in the event of disability or death. I would like to present three main points related to the future of Social Security, and indeed all sources of retirement income for the future. These are: (1) the aging of our population and the implications for the financial status of Social Security and retirement income in general, (2) the level and adequacy of monthly retirement benefits provided by Social Security, and (3) some of the changes that members of Congress and others have considered for strengthening the financial status of Social Security and the benefits it provides.
(1) The Aging of the United States Population and Implications for Retirement Income
The United States and the entire world are facing dramatic population aging now and in the future. We have generally thought of the aging of the population in terms of increasing longevity resulting from declining death rates at all ages. This has been a steady and gradual process with predictable results for decades. However, there has also been a dramatic change in the “age distribution” of the U.S. population, starting with the retirement of the baby boom generation around 2008 and continuing through about 2035. This shift in the age distribution is due to the drop in the birth rate experienced after 1965. To make this point more clearly, we have started to refer to the steady, gradual increase in longevity for individuals as “micro aging” and the dramatic shift in the age distribution of our population as “macro aging.”
The dramatic effects of macro aging due to the drop in birth rates after 1965 can be readily seen in the “aged-dependency” ratio, which is the ratio of people age 65 and over to the population at working ages between 20 and 64. This ratio tends to rise gradually as death rates gradually decline. However, the rise accelerated dramatically after 2010 and will continue to rise as the “baby boom” generation (those born in years 1946 through 1965) moves from working age to retirement age over the next 20 years. This shift in the aged dependency ratio is not temporary, but is a permanent level shift in the age distribution of our population. This shift will affect not only Social Security financing but all aspects of retirement income for the future. (In the figures below, “TR” refers to the annual Social Security Trustees Report.)
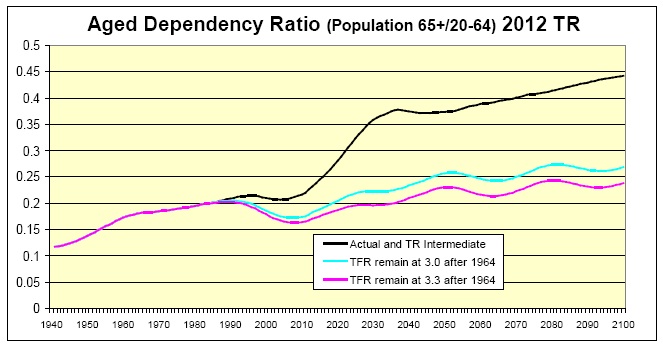
To illustrate the fact that this shift in age distribution is due to the drop in birth rates, we have developed hypothetical estimates of the aged dependency ratio assuming that the “total fertility rate” for the U.S had stayed close to the historical average of 3.0 children per woman, or had moved to the slightly elevated level of 3.3 children per woman experienced in the baby boom. If the birth rate had not dropped after 1965, the slow rise in aged dependency ratio due to gradual declines in death rates would not alone have created the macro aging effect we now face. The drop in the total fertility rate from about three children per woman before 1965 to about two children per woman since then (and projected for the future) explains the permanent level shift in the aged dependency ratio.
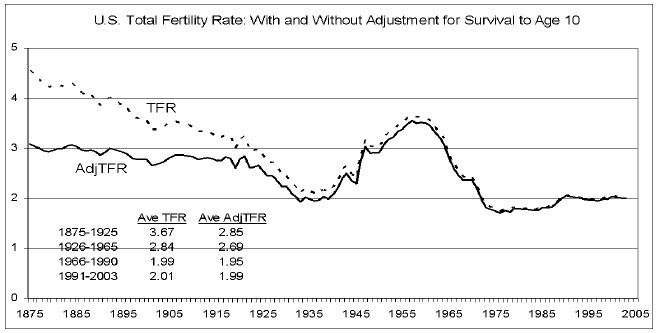
In the figure above, we illustrate the actual total fertility rate since 1875, as well as an “adjusted” total fertility rate where we include only births that will survive to at least age 10. Births that do not survive to age 10 will not enter the working age population and will not affect the aged dependency ratio.
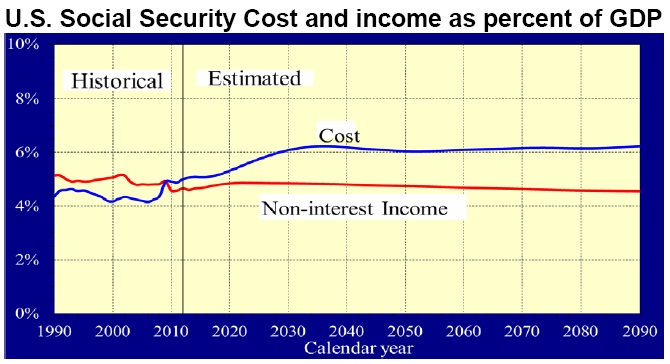
The implications of macro aging for the Social Security program, and indeed for all retirement income, are direct and clear. The cost of Social Security benefits scheduled in current law rises in direct proportion to the change in the aged dependency ratio.
The challenge before us in strengthening the actuarial status of the Social Security program is due to macro aging. This realization will hopefully help guide lawmakers in selecting adjustments to the program’s income and outgo for the future that are appropriate and serve the needs of all Americans.
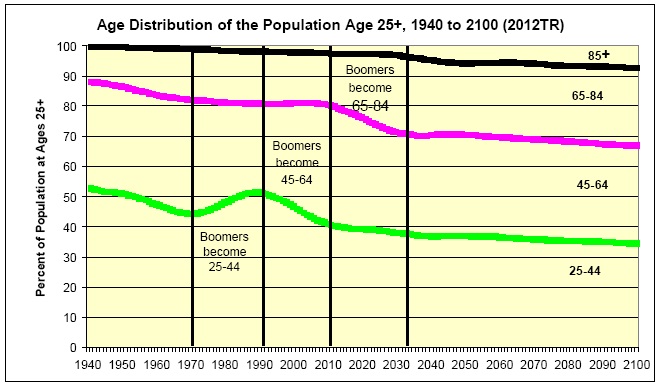
The macro aging effect for retirement costs illustrated by the aged dependency ratio is just one dimension of the macro aging effect. Marco aging of the age distribution has already had a profound effect on the cost of Social Security Disability Insurance (DI) benefits. DI benefits are available until normal retirement age (currently age 66) for insured workers who become unable to work due to a medically determinable impairment. The baby boom generation moved into young adult ages 25 through 44 between 1970 and 1990, increasing the number of people in the workforce much more than they increased the numbers of disabled workers. Between 1990 and 2010, the reverse occurred as the baby boom generation then moved into ages 45 through 64, which are the principal disability-prone ages.
The figure below shows the historical and projected age distribution of the adult population and illustrates the dramatic effects of the movement of the baby boom generation over time. This dramatic effect would, of course, not be as notable or important if the birth rate had not dropped so precipitously after 1965. In fact, if the birth rate had not dropped, the baby boom generation would not be extraordinarily large in relation to the following generations.
As a hypothetical illustration of the impact of the drop in birth rates after 1965, the figure below shows how different the age distribution of the U.S. population would have been if the overall total fertility rate had stayed at 3.0 children per woman after 1964.
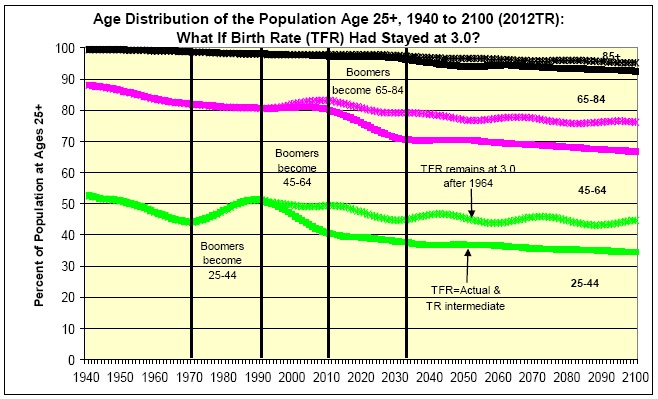
As with the aged dependency ratio, we see that the change in the adult age distribution (macro aging) would have been far more gradual and less severe if birth rates had not dropped to a permanently lower level after 1964.
(2) Level and Adequacy of Monthly Social Security Retirement Benefits
Social Security benefits have always been intended to provide a floor of protection for retirees, as well as for disabled workers and the families of deceased workers. Employer-provided pensions and personal savings complete the “three legged stool” for retirement income. Traditionally, many employer-sponsored pension plans provided a “defined benefit” in the form of a monthly annuity for life that complemented the life annuity provided by Social Security.
In the past two decades, employer-sponsored defined benefit plans have been largely replaced with “defined contribution” plans that provide a lump sum accumulation at retirement. Even when annuities are available to retirees, they are infrequently purchased. Moreover, increasing numbers of defined benefit plans are offering lump sum distributions. This trend has left Social Security as the sole source of lifetime retirement income for most Americans, and in general the only source that is adjusted for price increases after retirement. Retirees are increasingly at risk for having no income other than Social Security benefits at older ages.
The average Social Security retired worker benefit in 2013 was $1,270 per month, or about $15,240 if received for a full year. Average earnings for workers in the U.S. were about $44,000 in 2013. Thus, benefits represented about 35 percent of the level of average earnings.
Of course, Social Security benefits are based only on earnings subject to the payroll tax, which was a little over 82 percent of total earnings for covered workers in 2013. This means that the average retired worker benefit is about 42 percent of the average taxable earnings of workers in 2013. This is well below the target level that workers generally want in retirement, again suggesting the importance of other sources of retirement income.
A fuller illustration of the level and adequacy of Social Security retirement benefits can be seen by looking at retirement benefit “replacement rates.” Traditionally, a target benefit replacement rate has been thought to be around 70 to 80 percent of late-career or final pay for a steady, long-career employee. For Social Security beneficiaries, this approach of using late-career or final pay would be inappropriate. The earnings patterns of American workers across their careers are extremely varied. The level of Social Security retirement benefits under current law is based on an average of 35 years of earnings indexed to age 60 using the national average wage index (AWI). This approach puts earnings over a worker’s career on an equivalent basis to the average wage level, that is, the average standard of living for wage earners in the year the retiree turned 60. This approach approximates the late-career earnings level of steady career earners toward the end of their careers.
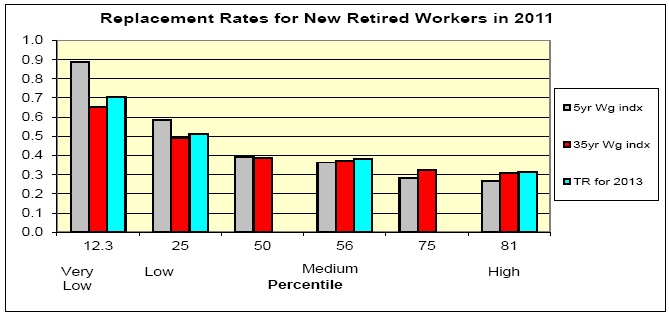
The figure below illustrates the benefit replacement rate for hypothetical workers retiring at age 65 with various career-average earnings levels. The replacement rate here compares the benefit in the first full year of retirement to the high 35 years average earnings indexed by the AWI to the year before retirement. Future retirees starting benefits at age 65 will have a replacement rate of about 50 percent at the 25th percentile of earners, about 40 percent for the 56th percentile of earners, and about 30 percent for workers at the 81st percentile of career-average earnings.
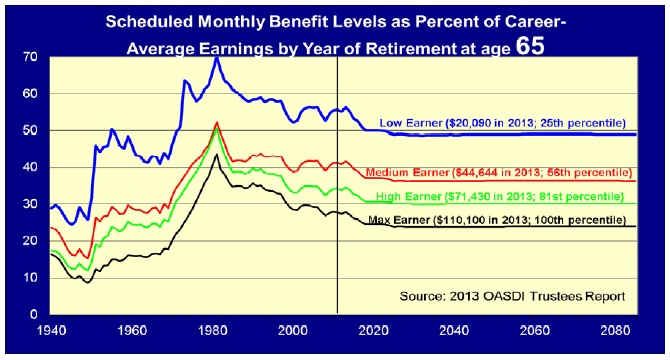
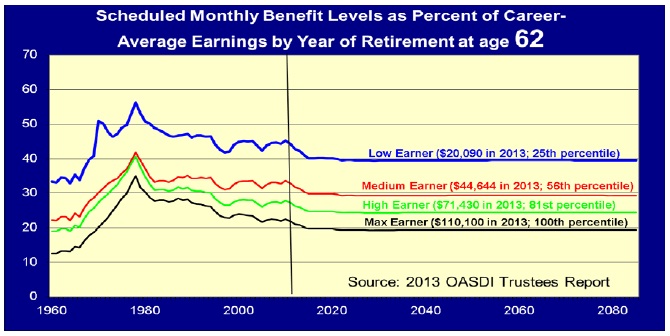
However, the largest portion of Social Security retirees (about half) start benefits at age 62. Benefit replacement rates are far lower for benefits starting at age 62 due to the actuarial reduction factors for early retirement.
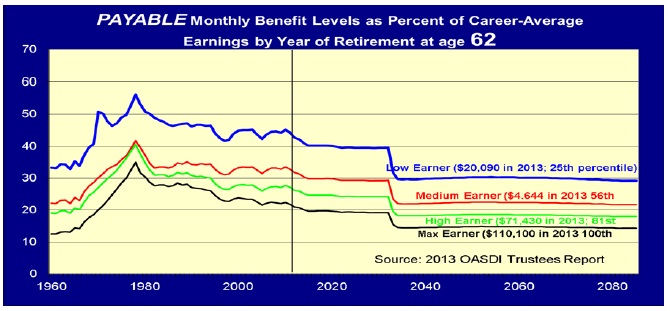
Given the financial shortfall facing Social Security by 2033, the level of benefits payable to retirees will drop by about 25 percent in 2033 if no legislative action is taken before then.
The benefit replacement rates illustrated above are consistent with the underlying approach for determining benefits under current law, and are also consistent with the approach used by the OECD in evaluating benefit levels for social insurance plans in economically developed nations. The OECD recognizes that in the general economy, earnings patterns for individual workers vary widely. The approach of using long career average earnings, indexed to the year before starting benefits, is qualitatively equivalent to using late-career or final pay for long-career steady workers. However, this is not the only plausible approach to developing benefit replacement rates for social insurance.
In order to explore the implications of other earnings concepts on benefit replacement rates, the Office of the Chief Actuary has analyzed a 10 percent sample of all new retired workers in 2011. This is a sample of over 200,000 new beneficiaries. The average age at the start of benefit receipt for this group was about 63.75 years, about halfway between 62 and 65. For the comparison in the figure below, replacement rates from the 2013 Trustees Report were adjusted to reflect a benefit start age of 63.75 years, consistent with the sample average benefit start age.
The figure below compares the benefit replacement rates consistent with those for hypothetical scaled workers from the 2013 Social Security Trustees Report (blue bars) to the replacement-rate distributions from the 2011 new beneficiaries using two different concepts. The red bars for the 2011 new beneficiaries show benefit replacement rates relative to the high 35 years of earnings indexed to the year before benefits start using the AWI. It is not surprising that replacement rates under this approach are very close to those from the Trustees Report, adjusted for equivalent average age at benefit start.
The gray bars provide a further replacement rate concept for comparison. For this approach, we selected the last six years of non-zero earnings prior to benefit start and dropped the last such year (because generally the last year of earnings before retirement will include only earnings for a half year). The selected years are indexed to the year prior to benefit start by the AWI, because many of these years are well before the benefit start age. At the median of the distribution, this approach to developing replacement rates provides values extremely close to both those for the 35-year career average for 2011 new beneficiaries, and those from the Trustees Report for hypothetical scaled workers. For other than the median earnings level, the gray bars demonstrate a wider divergence than shown for the median replacement rate, because average earnings levels over just five years prior to retirement are more varied than career average earnings over 35 years.
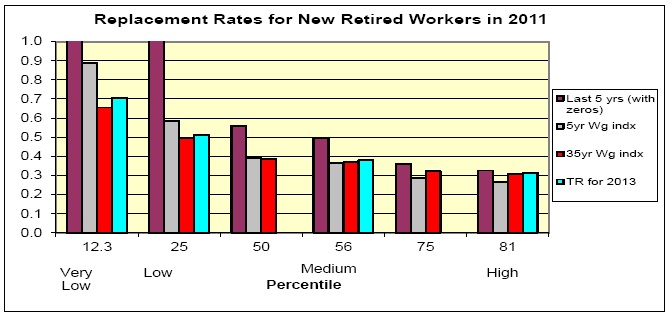
For a further comparison, we computed the benefit replacement rates for the 2011 new beneficiaries using the average of earnings in the last five calendar years immediately prior to benefit start, including years of zero or very low earnings. These values are shown in the maroon bars in the figure above. This approach is flawed as a proxy for the benefit replacement as a percent of actual earnings, because 25 percent of years in the last five before benefit start had zero earnings. In addition, about 15 percent of the new beneficiaries had no earnings at all in the five years before starting benefits. Given this, it is not surprising to see that replacement rates computed in this way are considerably higher than those computed using the other approaches.
Overall, we see that at the median, benefits scheduled under current law provide roughly 40 percent of the 35-year career average and 5-year late-career average earnings levels. This is comparable to the ratio of the average annual benefit for retired workers to the average of taxable earnings in the same year.
If workers desire to have lifetime retirement income of 70 to 80 percent of earnings during their career, or near retirement, then they need to save more and purchase more life annuities. While career earners at the 12th percentile may have Social Security benefits as high as 70 percent of career average earnings, such individuals tend to be far more dependent on Social Security as a sole source of retirement income. About one-third of Social Security beneficiaries have little if any income outside of that provided by Social Security.
(3) Potential Changes for Strengthening Social Security Financial Status and Benefit Adequacy
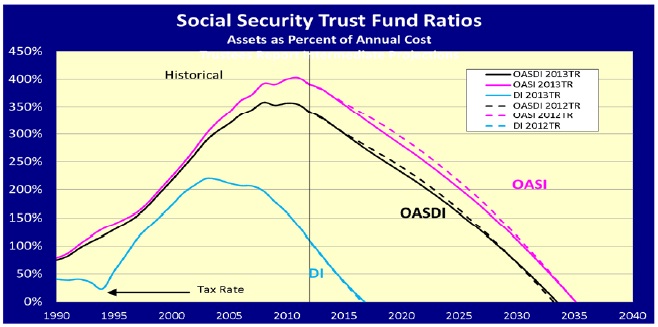
The Social Security program operates under the financing provided from two distinct trust funds, one for Old Age and Survivors Insurance (OASI) benefits and the other for Disability Insurance (DI) benefits. The trust fund reserves for the DI program are projected to become depleted late in 2016, so legislative action is needed soon. One approach would be a temporary reallocation of a portion of the payroll tax rate (total 12.4 percent) between the OASI and DI Trust Funds. Even with this reallocation, one or both of the reserves are projected to become depleted by 2033.
In order to avert depletion of trust fund reserves, changes will be necessary to (1) reduce scheduled benefit levels by about 25 percent, (2) increase scheduled revenue by about 33 percent, or (3) make some combination of these changes.
A wide variety of possible changes to the Social Security Act have been considered by members of the Congress and other policymakers. The Office of the Chief Actuary has developed estimates for many dozens of possible changes in both scheduled benefits and scheduled revenue. Our estimates provided to the sponsors of these proposals can be found at http://www.ssa.gov/oact/ at the links “Proposals” and “Provisions”.
In addition, many potential changes have been proposed and evaluated that would be intended to enhance, strengthen, or increase benefits for specific groups of beneficiaries. Such proposals include restoration of student benefits, increase of the special minimum benefit, increase in aged surviving spouse benefits, and use of the CPI-E (based on purchase patterns by persons age 62 and older) instead of the CPI-W (based on purchases of urban wage earners.)
Conclusion
Social Security benefits continue to be the primary “floor of protection” for Americans in retirement, for those disabled, and for the surviving family members of workers when they die. Because of the reduced birth rates after 1965, the U.S. is entering a period of dramatic macro aging that has already affected the cost of the DI program over the past 20 years.
Changes are needed soon to avert trust fund reserve depletion and an abrupt reduction in the level of benefits payable with scheduled income. The Congress, on behalf of the American people, will need to decide whether to (1) maintain currently scheduled benefit levels, which would require increasing program revenue from 4.5 to 6 percent of GDP, (2) reduce scheduled benefits by 25 percent, or (3) implement some combination of these options.
Many options for reducing benefits and/or increasing revenue have been considered by members of Congress and have been scored by the Office of the Chief Actuary. In addition, many proposals have been developed that would enhance and strengthen currently scheduled benefits for select groups of worker beneficiaries and their families. We look forward to working with this Subcommittee, others in Congress, and the Administration to develop adjustments to Social Security to maintain solvency for the program and assure the American people that these essential benefits will continue for future retirees, future disabled workers, and their families.